Bulk exports cover Markets and Fills. Orderbook snapshots are not available as file downloads — query the
orderbook_snapshots table directly via SQL instead. See the SQL Guide.Getting Started
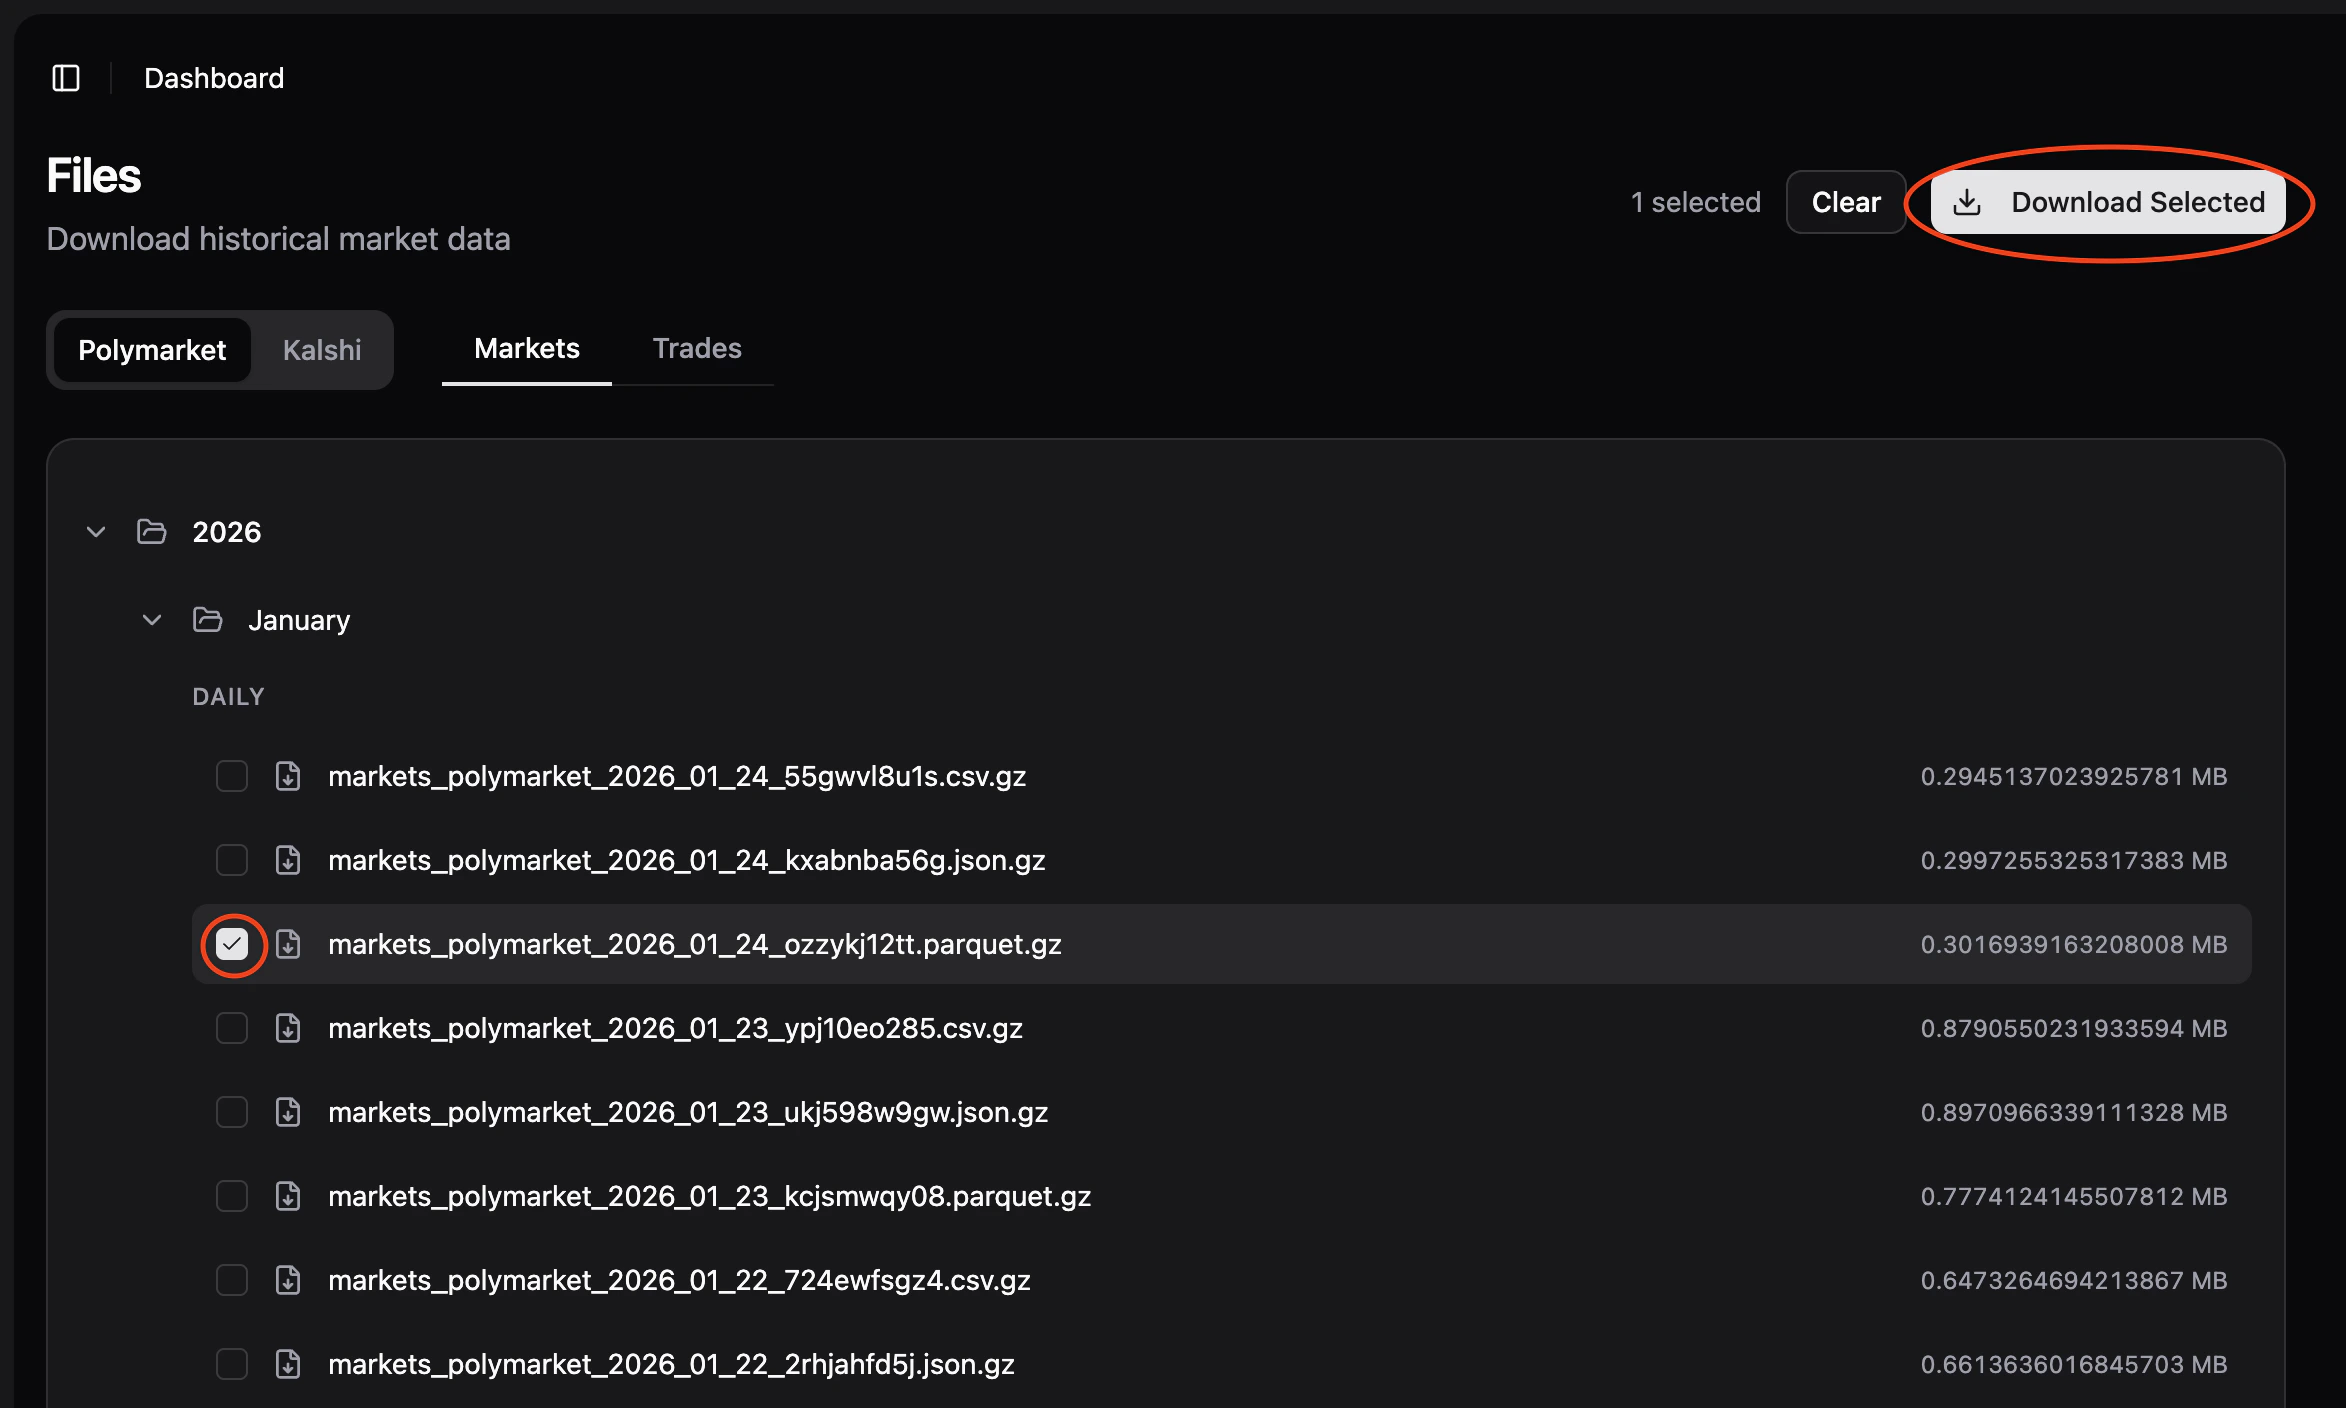
Access Files
Log into app.probalytics.io and navigate to the Files section.Select Data
Use the interface to choose:- Platform: Polymarket or Kalshi
- Entity type: Markets or Fills
- Frequency:
- Markets: Monthly
- Fills: Weekly
- File: Browse available exports in the file tree
File Format
All files are exported as Parquet (.parquet.gz), automatically gzipped for efficient transfer.
- Columnar format, highly compressed
- Native support: Python (pandas, polars), R, Go, Java
- Best performance for analytical queries
File Naming
Files follow this pattern:- Weekly: Mondays at 02:30 UTC (Fills)
- Monthly: First day of month at 03:00 UTC (Markets)